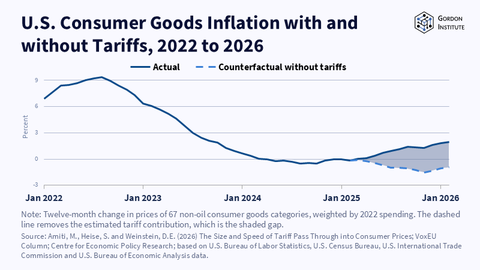
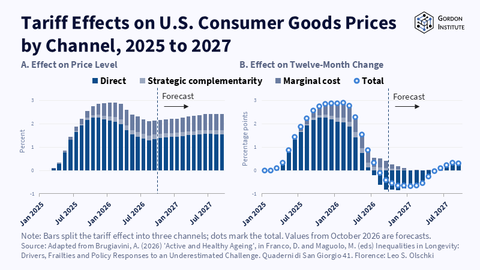
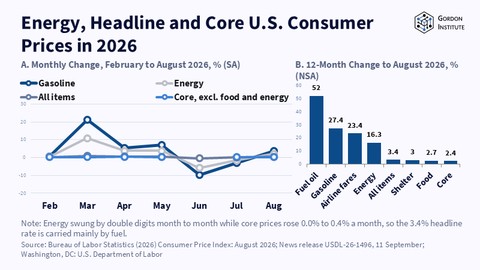
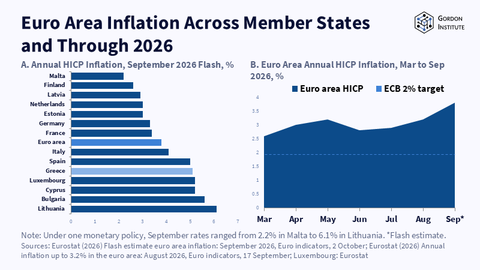
Tariff Effects on U.S. Consumer Goods Pri by Channel, 2025 to 2027
Picture

Real name
Gordon Institute Chart
Bio
Gordon Chart is the institutional data visualization and quantitative research account of Gordon Institute.
It produces charts, figures, analytical exhibits, and visual summaries supporting the firm's work across consulting, artificial intelligence, scientific modeling, and capital. Gordon Chart translates quantitative evidence, research findings, market data, and analytical models into concise visual formats designed to make complex relationships easier to interpret.
It produces charts, figures, analytical exhibits, and visual summaries supporting the firm's work across consulting, artificial intelligence, scientific modeling, and capital. Gordon Chart translates quantitative evidence, research findings, market data, and analytical models into concise visual formats designed to make complex relationships easier to interpret.
Input
Modified
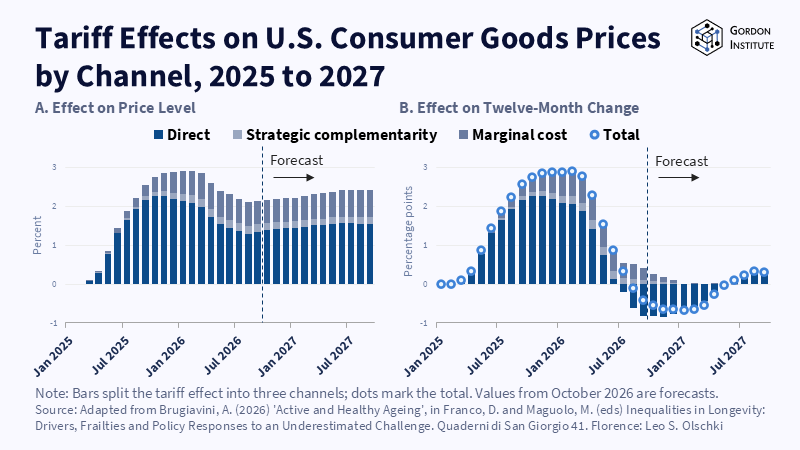
Related articles: The Division of Labour in Inflation Policy: Tariffs, Energy, and the Limits of Central Banks
Picture
Real name
Gordon Institute Chart
Bio
Gordon Chart is the institutional data visualization and quantitative research account of Gordon Institute.
It produces charts, figures, analytical exhibits, and visual summaries supporting the firm's work across consulting, artificial intelligence, scientific modeling, and capital. Gordon Chart translates quantitative evidence, research findings, market data, and analytical models into concise visual formats designed to make complex relationships easier to interpret.
It produces charts, figures, analytical exhibits, and visual summaries supporting the firm's work across consulting, artificial intelligence, scientific modeling, and capital. Gordon Chart translates quantitative evidence, research findings, market data, and analytical models into concise visual formats designed to make complex relationships easier to interpret.
Similar Post