
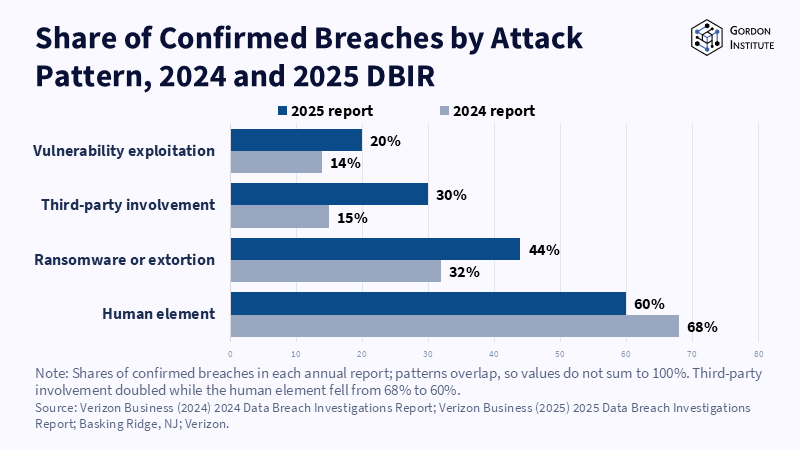
Figure: Third-party breaches doubled in a year as the human-element share slipped. Related articles: AI Cyb
Read More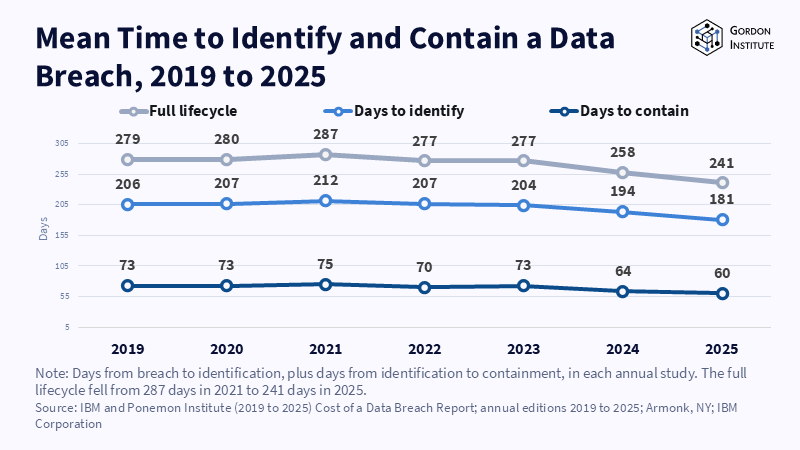
Figure: Breach lifecycles shortened by 46 days from 2021 to 2025, mostly at detection. Related articles: AI C
Read More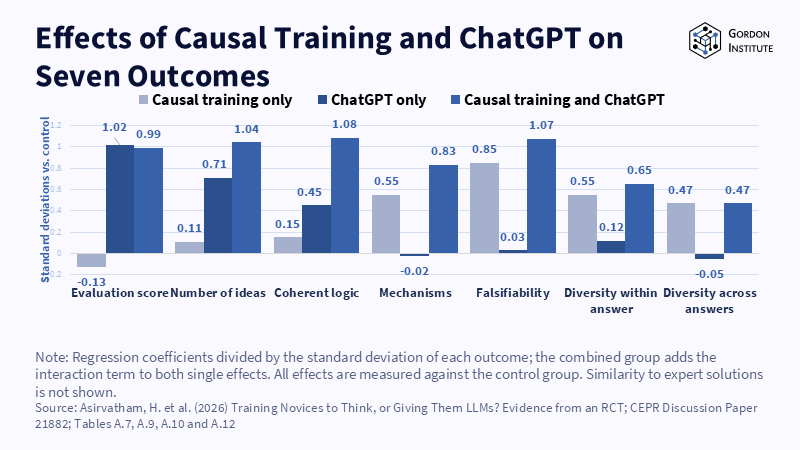
Figure: ChatGPT lifts scores; only the trained reasoning moves mechanisms and falsifiability. Related articles: Beyond Exper
Read More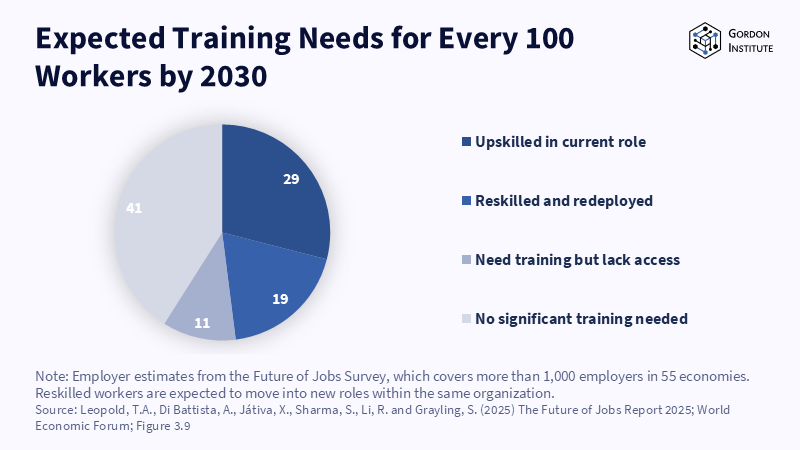
Figure: Employers expect to retrain nearly half their workforce in place rather than replace it. Related articles: Beyond Exper
Read More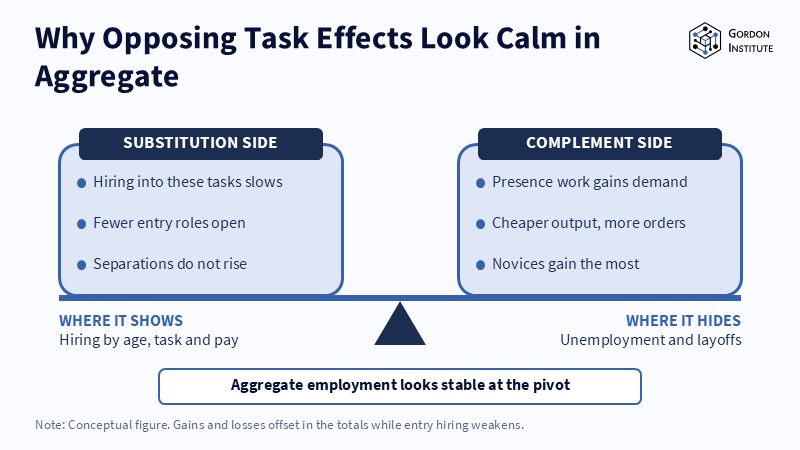
Figure: Losses and gains balance in the totals, so the change shows up in who gets hired, not in the unemployment rate. Related articles:
Read More







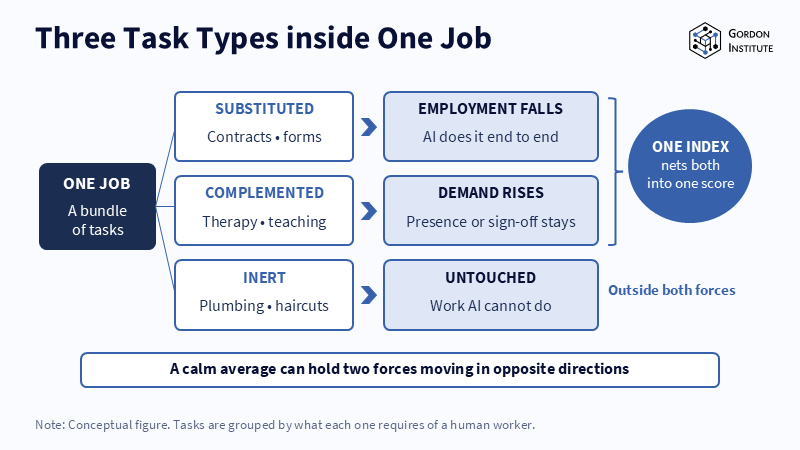
Figure: Substitution and complementarity pull in opposite directions inside the same job and a single exposure score adds them together. Related articles:
Read More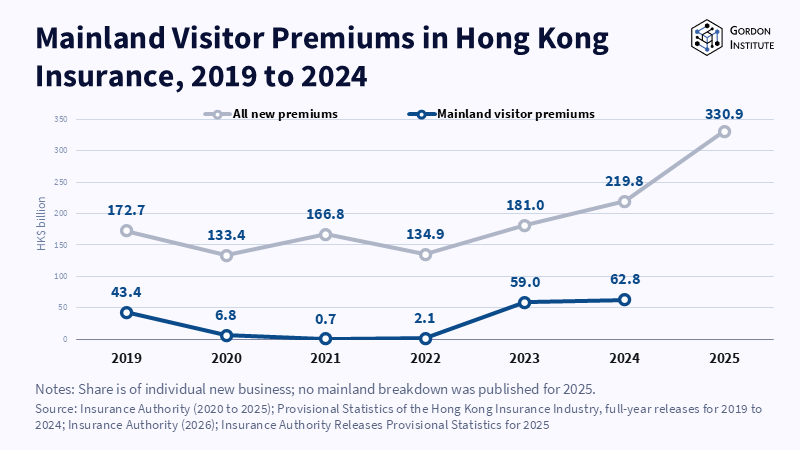
Figure: Mainland buyers came back to a third of new sales once the border reopened.
Read More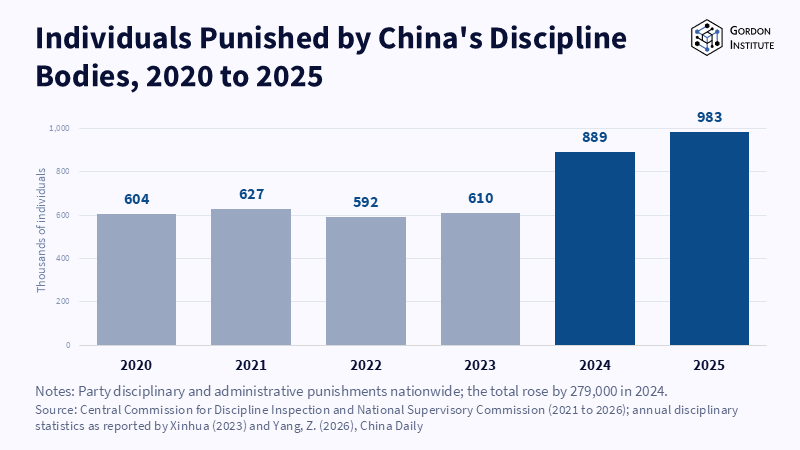
Figure: Punishments held near 600,000 for four years, then jumped 46 percent in 2024, the same year Beijing reopened channels to Hong Kong. Related articles:
Read More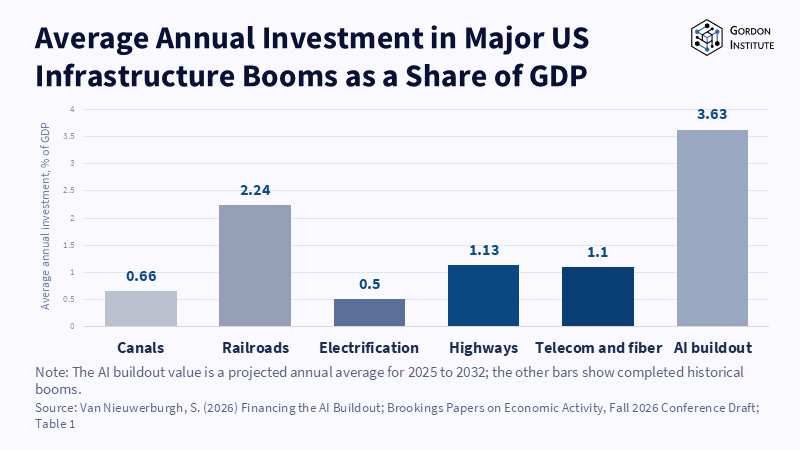
Figure: At 3.63% of GDP a year, the projected AI buildout is more than three times the telecom boom that left Global Crossing’s creditors with the loss.
Read More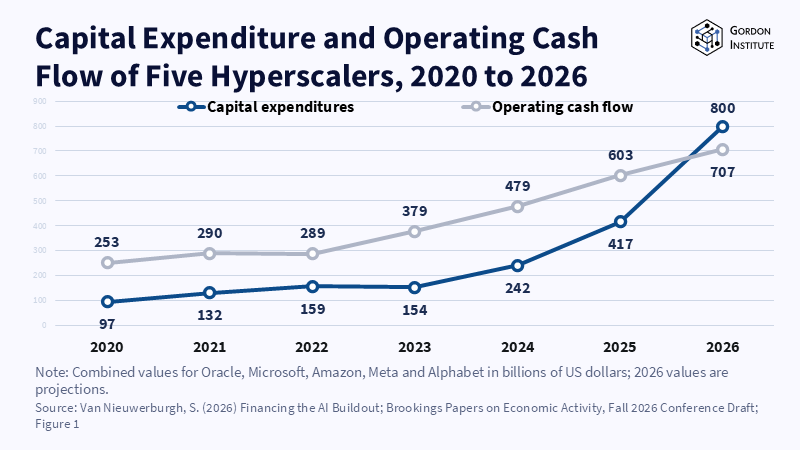
Figure: Hyperscaler capex is projected to overtake operating cash flow in 2026, so the gap has to be borrowed. Related articles:
Read More
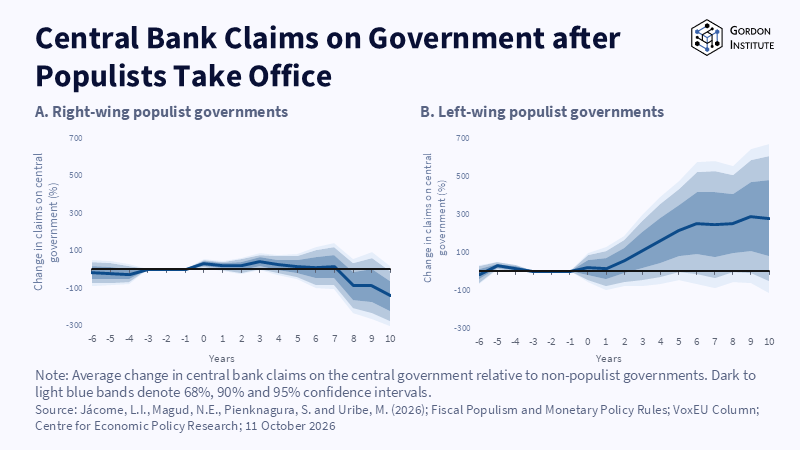
Figure: A decade after left-wing populists take office, central bank claims on the state are up close to 300%, while right-wing governments leave no lasting rise. Related ar
Read More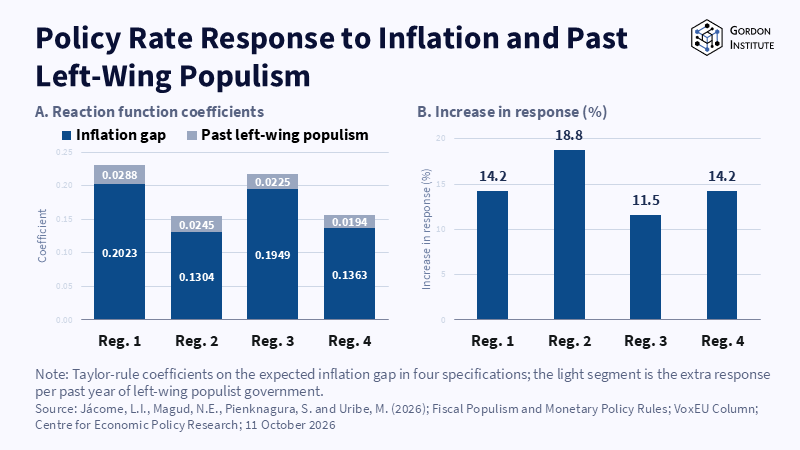
Figure: Each past year of left-wing populism makes today’s central bank react 11.5% to 18.8% harder to the same inflation gap. Related articles:
Read More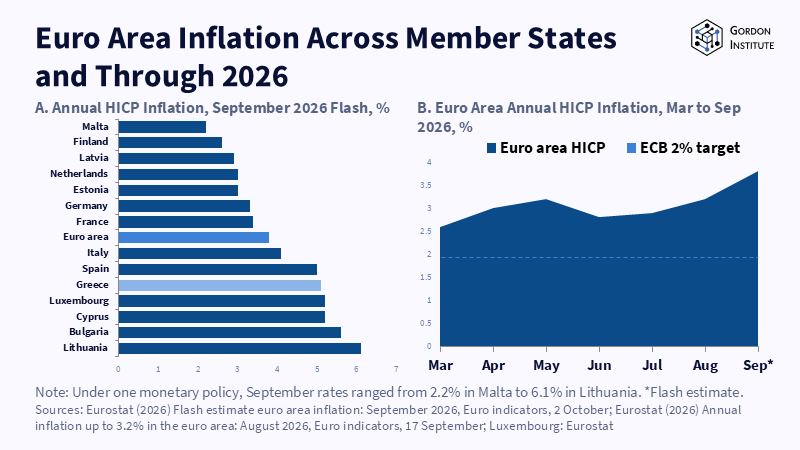
Figure: One energy shock and one interest rate produced 2.2% in Malta and 6.1% in Lithuania. Related articles: War’s Inflati
Read More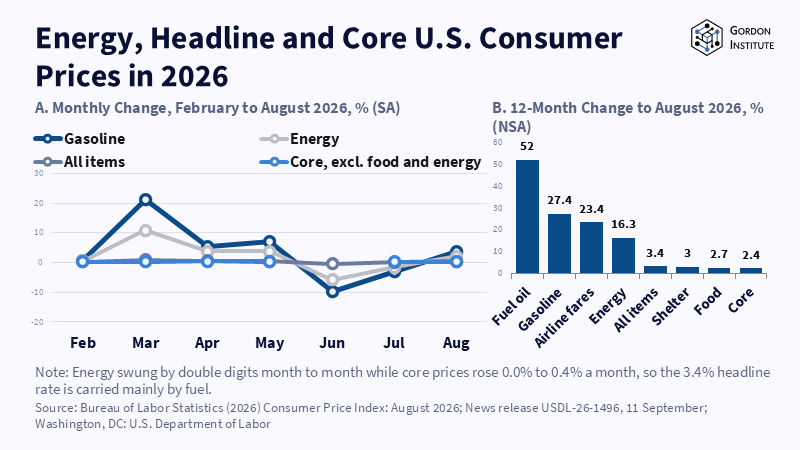
Figure: Gasoline jumped 21.2% in March alone while core prices never rose more than 0.4% a month. Related articles: War’s Inf
Read More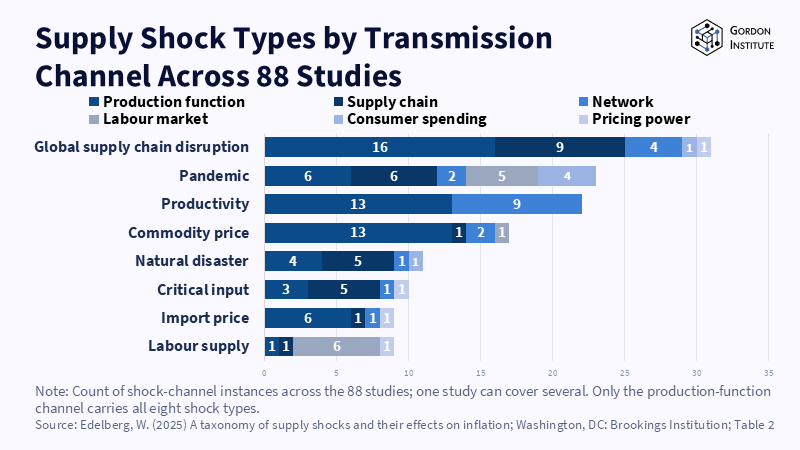
Figure: Commodity price shocks reach prices almost entirely through production costs, while supply chain and pandemic shocks spread across five channels at once. Related article
Read More
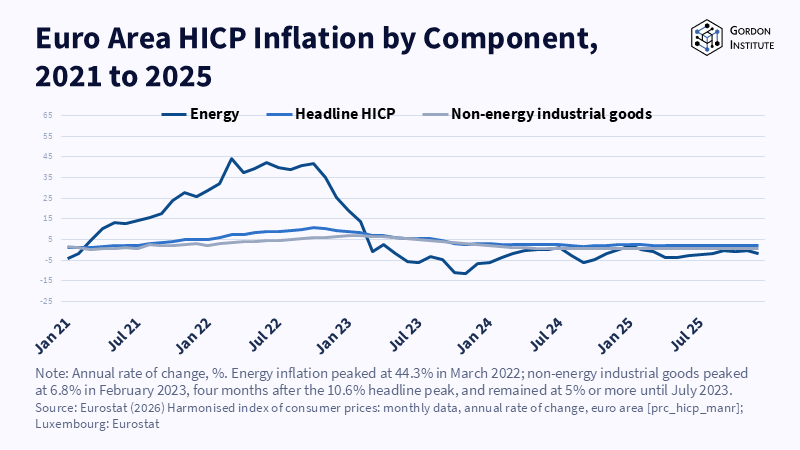
Figure: Energy inflation peaked in March 2022, but manufactured goods prices kept rising until February 2023, as the gas shock worked its way through factory costs. Related articles: <
Read More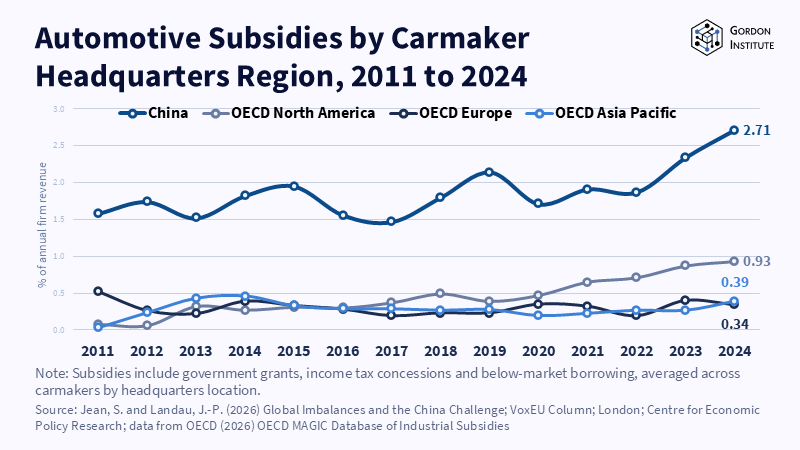
Figure: Chinese carmakers received subsidies worth 2.7 percent of revenue in 2024, nearly three times the North American rate and about seven times Europe’s. Related art
Read More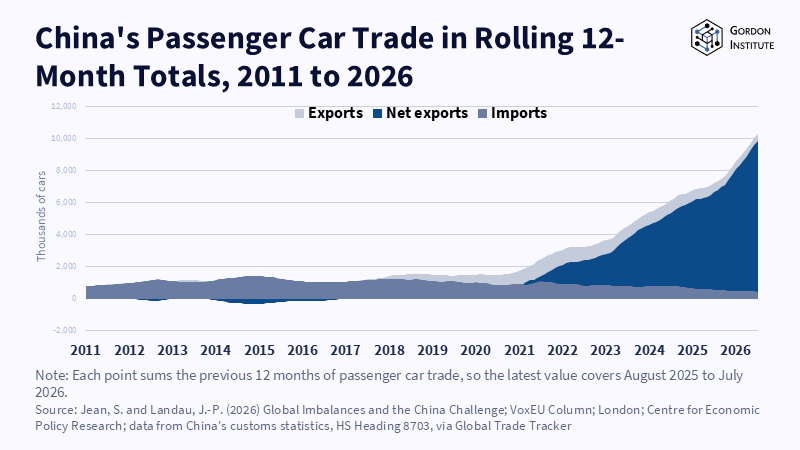
Figure: China imported more cars than it exported until 2017.
Read More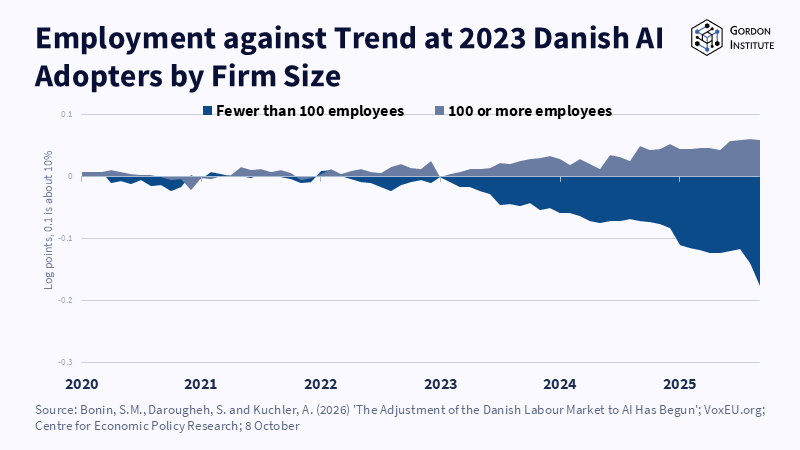
Figure: After adoption, small firms fell 16% below their own trend while larger firms edged above theirs. Related articles:
Read More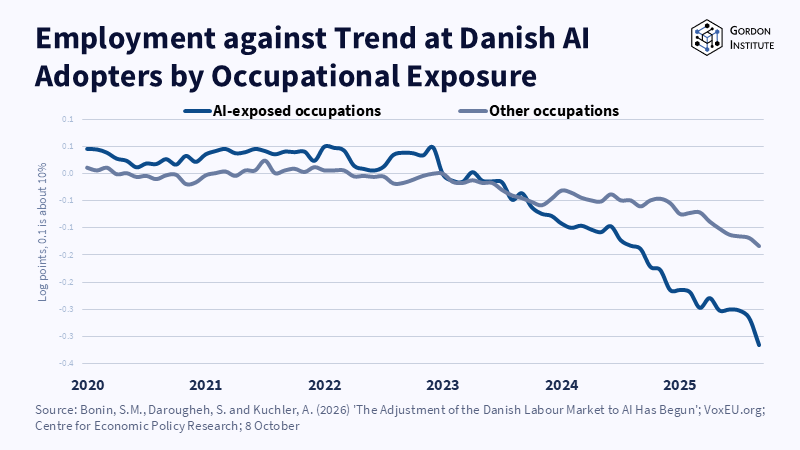
Figure: Exposed and unexposed jobs moved together until early 2023, after which the exposed line fell more than twice as far. Related articles:
Read More