
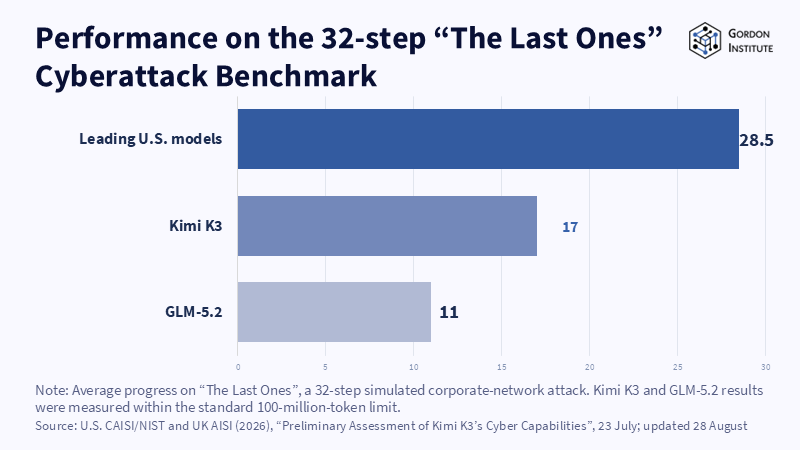
Figure: On a 32-step simulated attack, Kimi K3 completed barely six of every ten steps the leading US models did.
Read More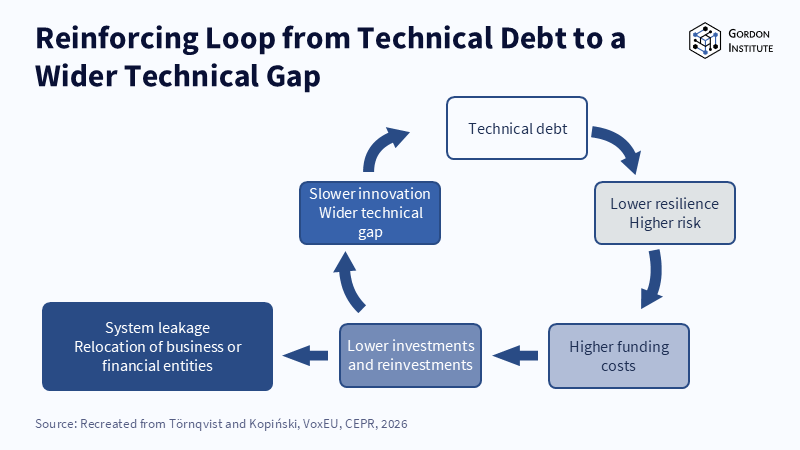
Figure: Each round of weaker defence raises funding costs and cuts reinvestment, which widens the gap that started the loop. Related articles:
Read More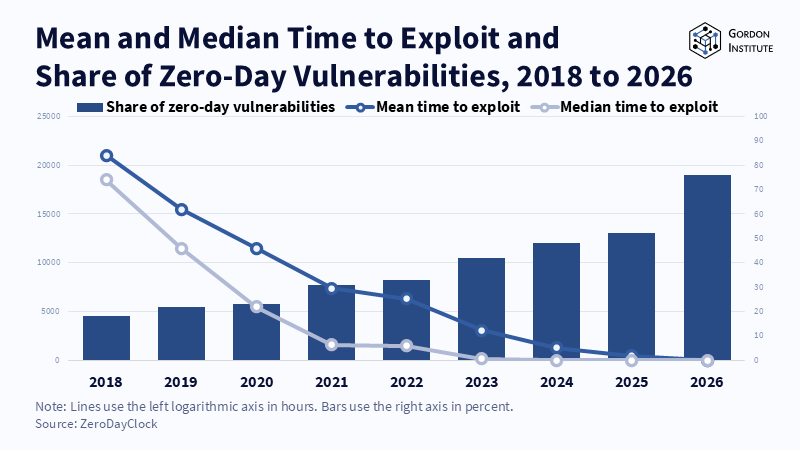
Figure: Mean time to exploit dropped below ten hours in 2026 as the share of zero-day vulnerabilities reached about three-quarters. Related ar
Read More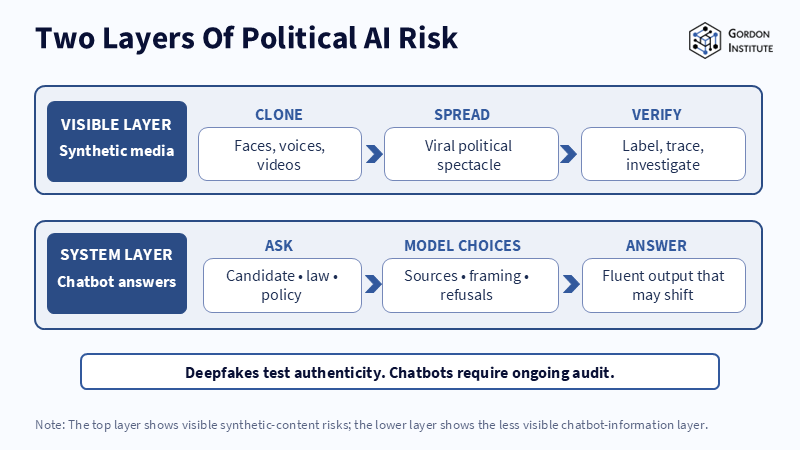
Figure: Deepfakes challenge authenticity at the surface; chatbot answers create a less visible accountability problem underneath. Related articles: Monitor
Read More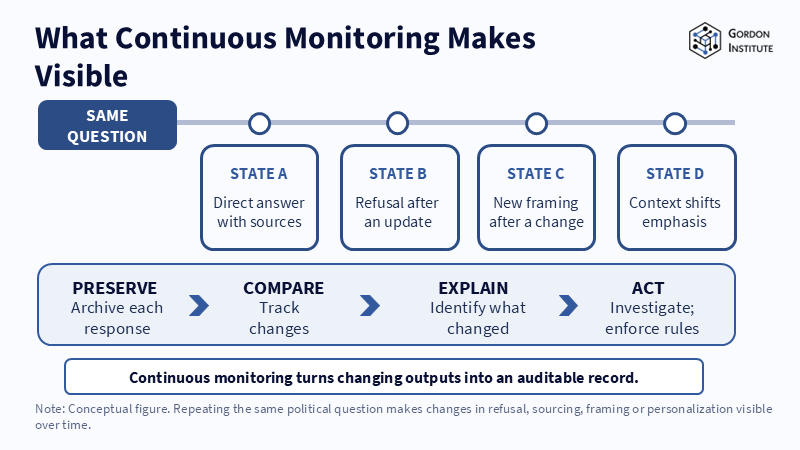
Figure: Repeated testing turns fleeting model changes into a record that can be compared and investigated. Related articles: Monitoring Political AI
Read More







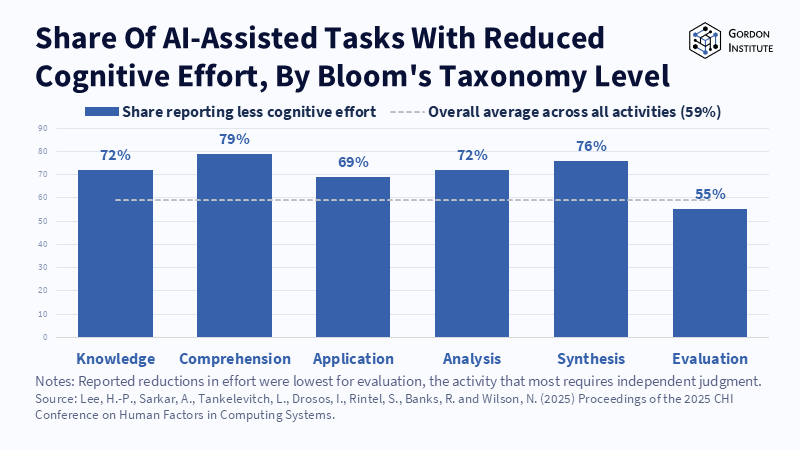
Figure: Reported reductions in effort were lowest for evaluation, the activity that most requires independent judgment. Related articles:
Read More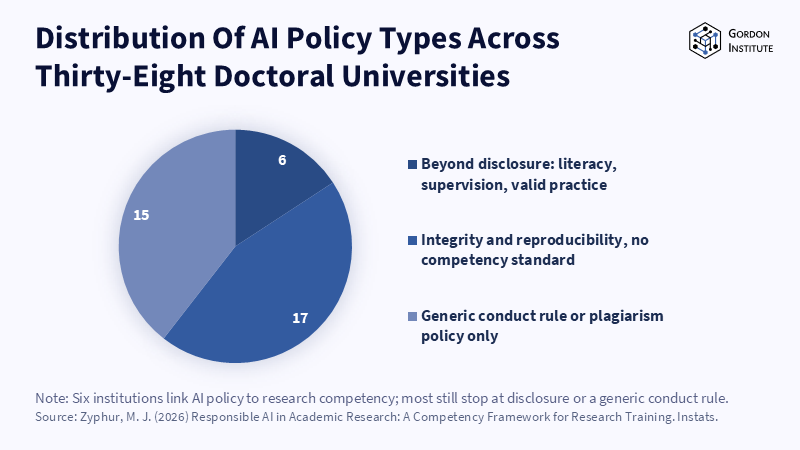
Figure: How Zyphur's 38-university sample splits across three policy types identified in his audit. Related articles:
Read More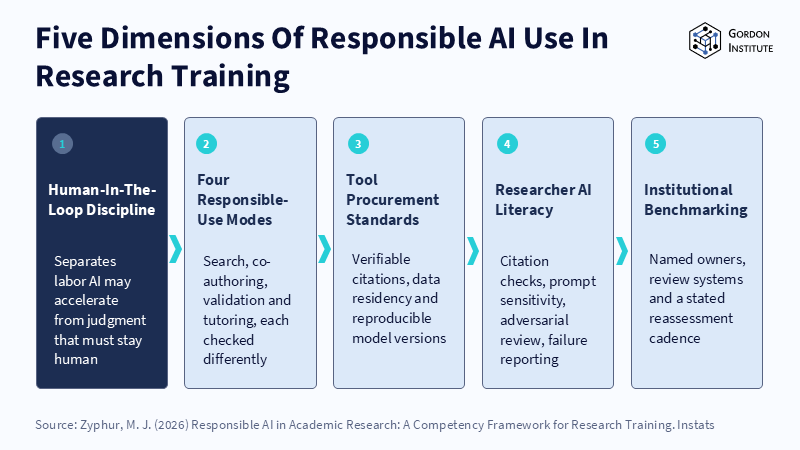
Figure: Only six of the thirty-eight doctoral universities studied had progressed through all five dimensions; fifteen remained at a generic conduct-rule stage. Related articles:
Read More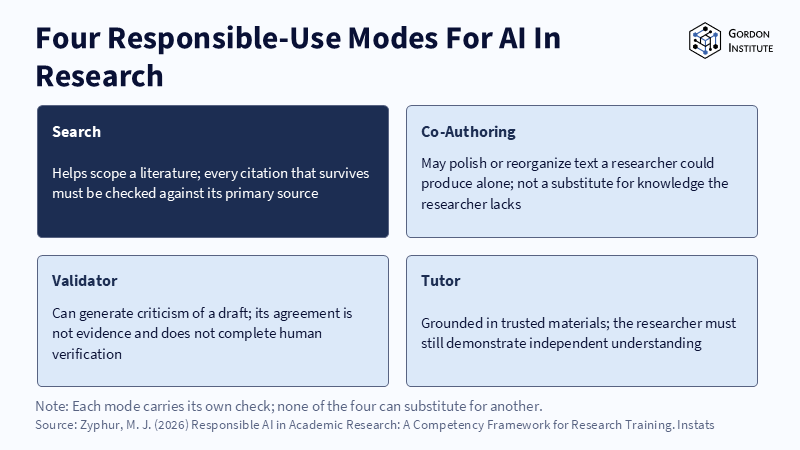
Figure: Zyphur’s framework distinguishes search, co-authoring, validator, and tutor functions, showing that each mode requires a different form of human verification and oversight. Related article
Read More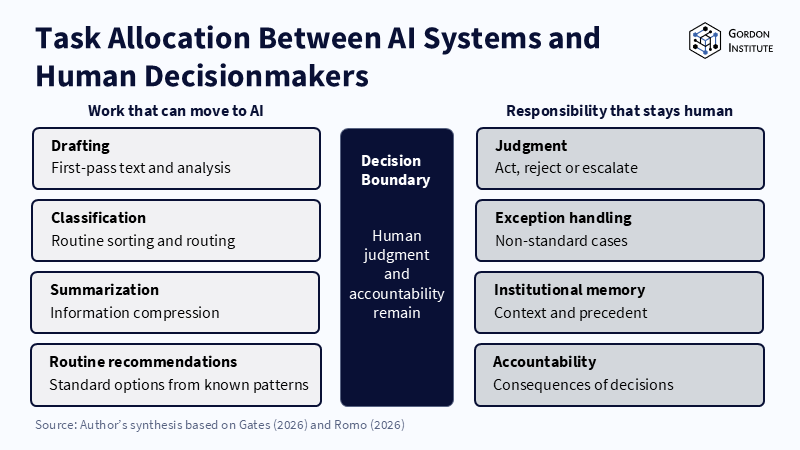
Figure: Routine production can shift to AI while judgment and accountability remain human. Related articles: The Human Revi
Read More
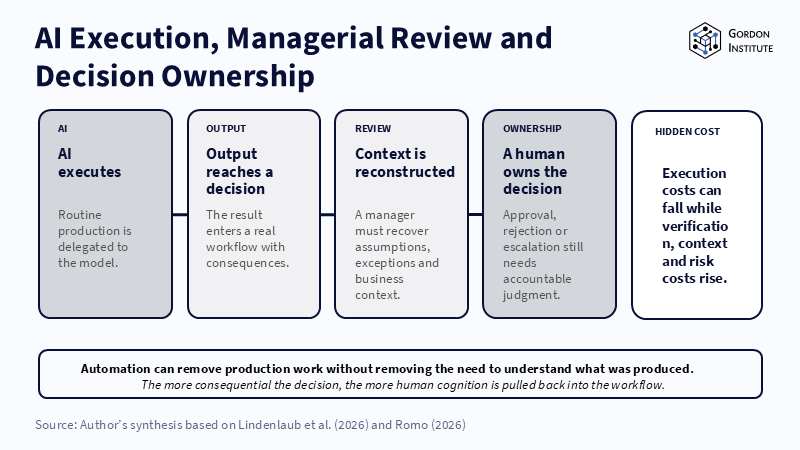
Figure: AI can reduce execution costs while shifting work into review and decision ownership. Related articles:
Read More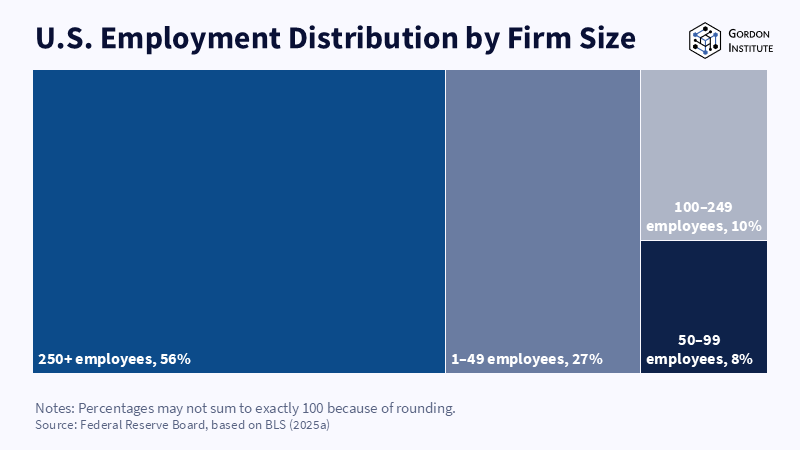
Figure: Large firms employ most U.S.
Read More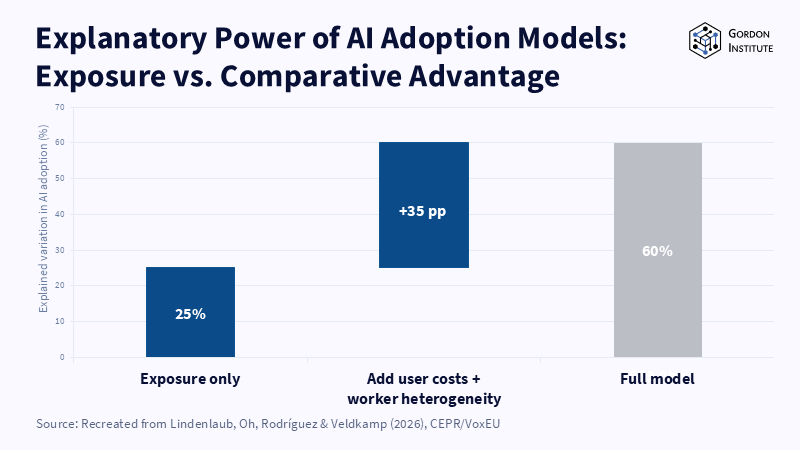
Figure: Accounting for costs and worker differences more than doubles the model’s explanatory power. Related articles: From AI Capability to Adopti
Read More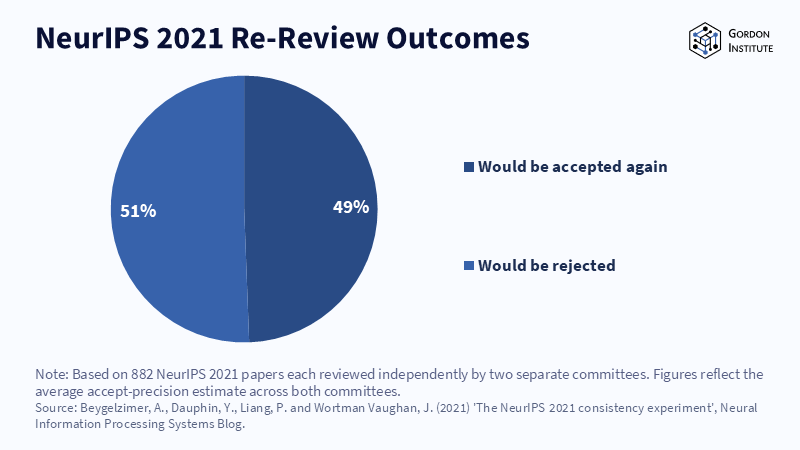
Figure: 50.6% of accepted papers would have been rejected on a second, independent review. Related articles: Verification in Scientific Publishing_What Checkab
Read More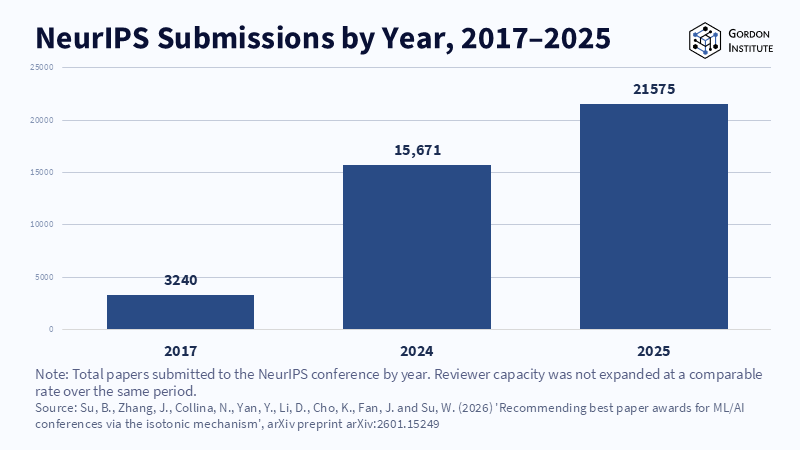
Figure: Submissions climbed from 3,240 in 2017 to 21,575 in 2025. Related articles: Verification in Scientific Publishing_What Checkable Cla
Read More
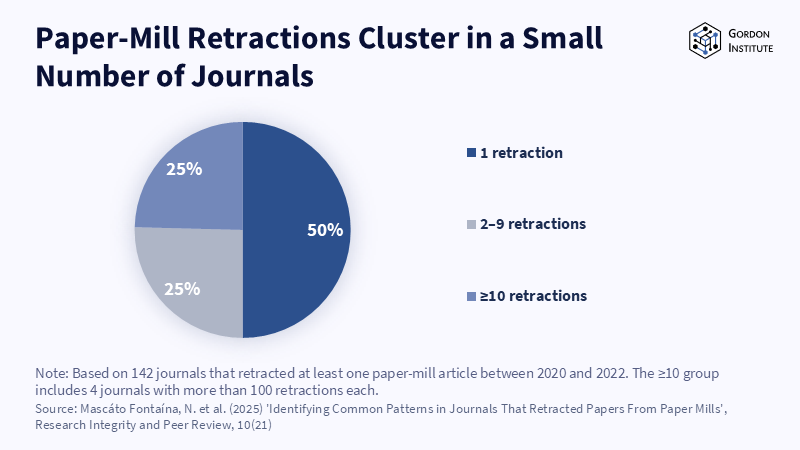
Figure: Half of 142 journals had one retraction; four had 100+. Related articles: Journal Accountability_Correcting the
Read More
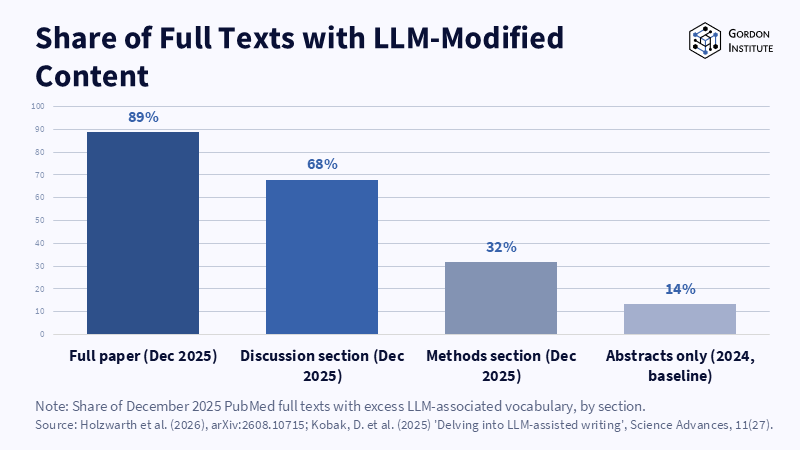
Figure: AI-influenced writing has moved from an occasional flag to the default state of the discussion section. Related articles: Agentic A
Read More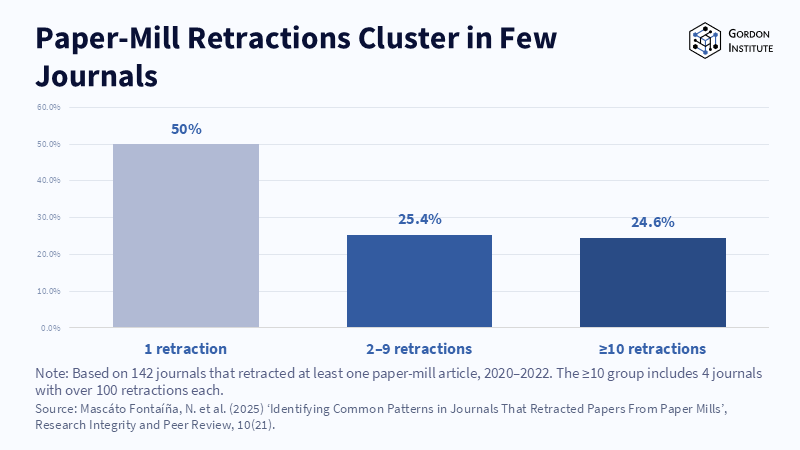
Figure: Half of all paper-mill retractions trace back to journals with just one flagged article; fraud concentrates, it doesn't spread evenly. Related articles:
Read More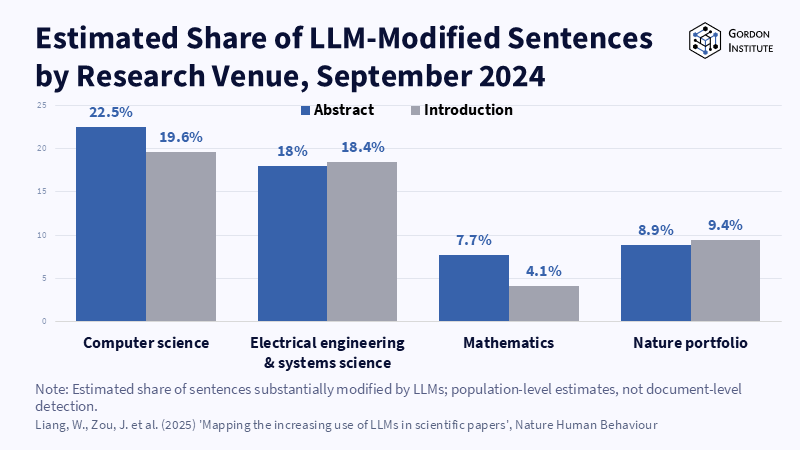
Figure: Computer science shows the sharpest jump in AI-modified writing of any field tracked. Related articles:
Read More